Generate Scanpath Visualisations
TIP
Picture this: Build and customise scanpath visualisations with your Reference Image Mapper, Marker Mapper, or Manual Mapper exports!
Visualising Gaze Exploration With Scanpaths
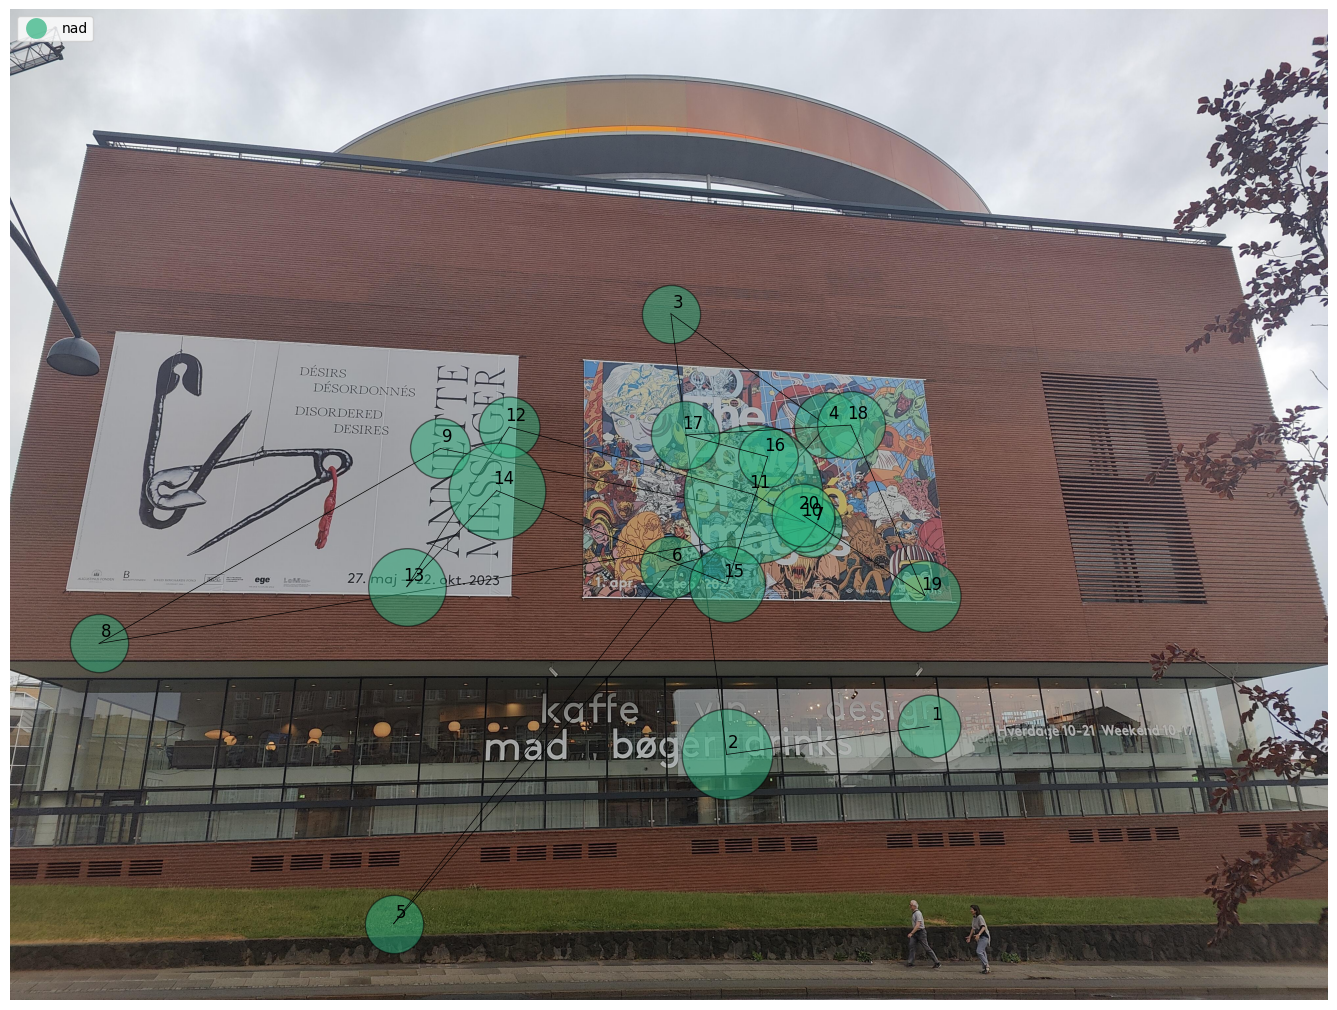
Scanpaths are graphical representations of gaze behaviour over time. They show how an observer has focused attention on different aspects of a scene, making them a valuable tool for understanding a person's visual attention and perception. The video above illustrates this concept. It shows:
- Fixation locations - Visualised as numbered circles
- Fixation durations - Mapped to the size of the circles. Longer fixations correspond to larger circles
- Saccades - Represented by lines connecting sequential fixations
- Saccade distances (between sequential fixations) - Reflected by the length of the lines. Longer lines correspond to bigger gaze shifts
In this guide, we will show you how to generate static and dynamic scanpath visualisations using your Reference Image Mapper, Marker Mapper, or Manual Mapper exported data.
TIP
Before continuing, ensure you are familiar with the Reference Image Mapper, the Marker Mapper, and the Manual Mapper enrichments.
Current Tools and Extended Possibilities
The Reference Image Mapper, Marker Mapper, and Manual Mapper enrichments in Pupil Cloud are tools that map fixations onto 2D images or surfaces. Following the completion of these enrichments, you can generate heatmaps, Areas of Interest, and also scanpath visualisations. Perhaps you're curious to build your own, or want something more bespoke? You can use this guide to make it so!
To automate the process as much as possible, you can download your data directly via the Pupil Cloud API. Alternatively, you can manually download the data and upload the unzipped folder to your Google Drive.
Steps
- Run a Reference Image Mapper, the Marker Mapper, or a Manual Mapper enrichment.
- Data from your enrichment needs to be loaded onto Google Drive. You can choose between one of two options:
- Use a Pupil Cloud API token to have the enrichment loaded into Google Drive automatically. You need to obtain a developer token from Pupil Cloud (click here to obtain yours).
- Download the enrichment manually from Pupil Cloud and then upload it to your Google Drive.
- Access our Google Colab Notebook and carefully follow the instructions.

If you want to work with the code locally, feel free to download it from this GitHub Repository.
Review the Scanpaths
After running the notebook, you'll find the following files in your folder:
Static scanpath visualisation: Saved as
scanpath_image.png, showing the reference image used for your enrichment with the scanpath superimposed on it. The scanpath will include the participant(s) you selected and the number of fixations chosen for visualisation. If you have multiple participants, an aggregated visualisation combining all participants' scanpaths will be available, enabling a more comprehensive overview of the subjects' gaze behaviour.Dynamic scanpath visualisation: A video featuring a dynamic scanpath overlay will be saved in your folder, separately for each wearer, e.g.,
scanpath_video_nadia.mp4.
TIP
Need guidance in further customising your scanpath visualisations? Reach out to us via email at info@pupil-labs.com, on our Discord server, or visit our Support Page for dedicated support options.
Undistort Video and Gaze Data
Learn how to undistort the scene camera distortions and apply it to gaze positions.
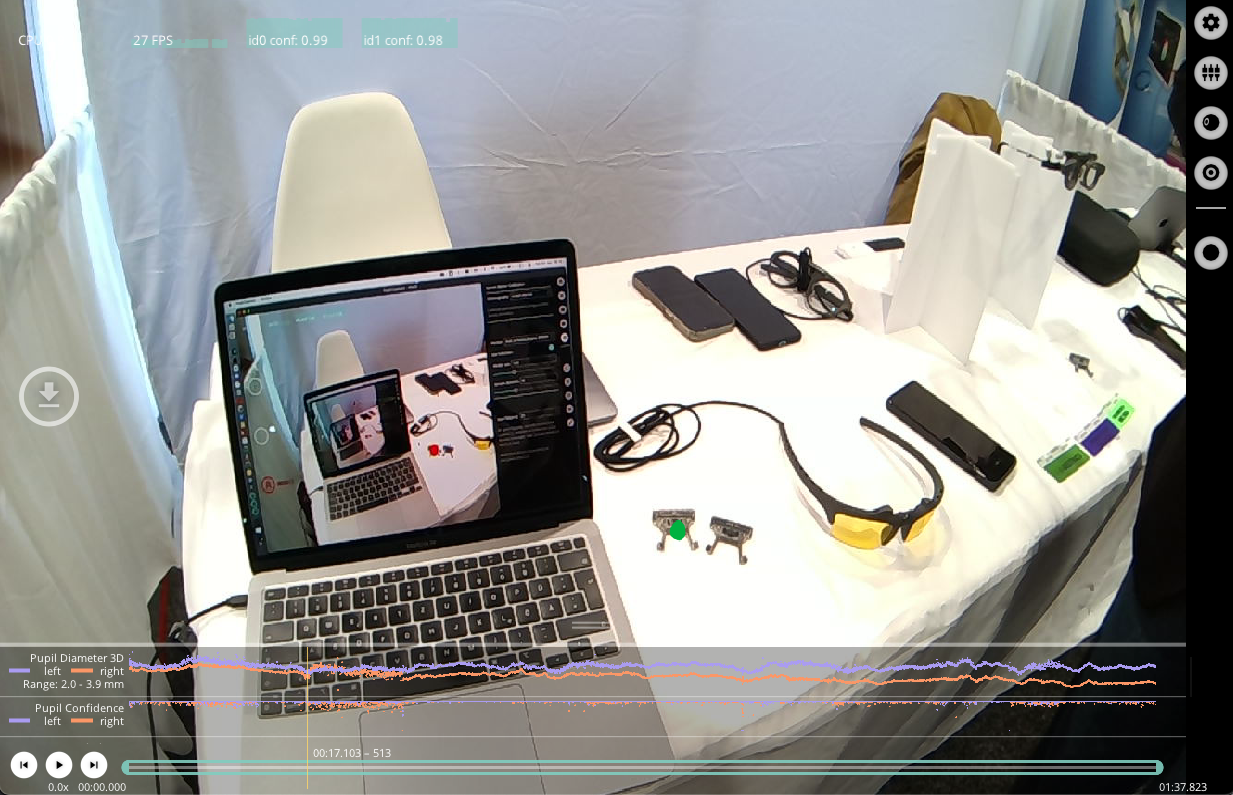
Use Neon with Pupil Capture
Use your Neon module as if you were using Pupil Core. Connect it to a laptop, and record using Pupil Capture.
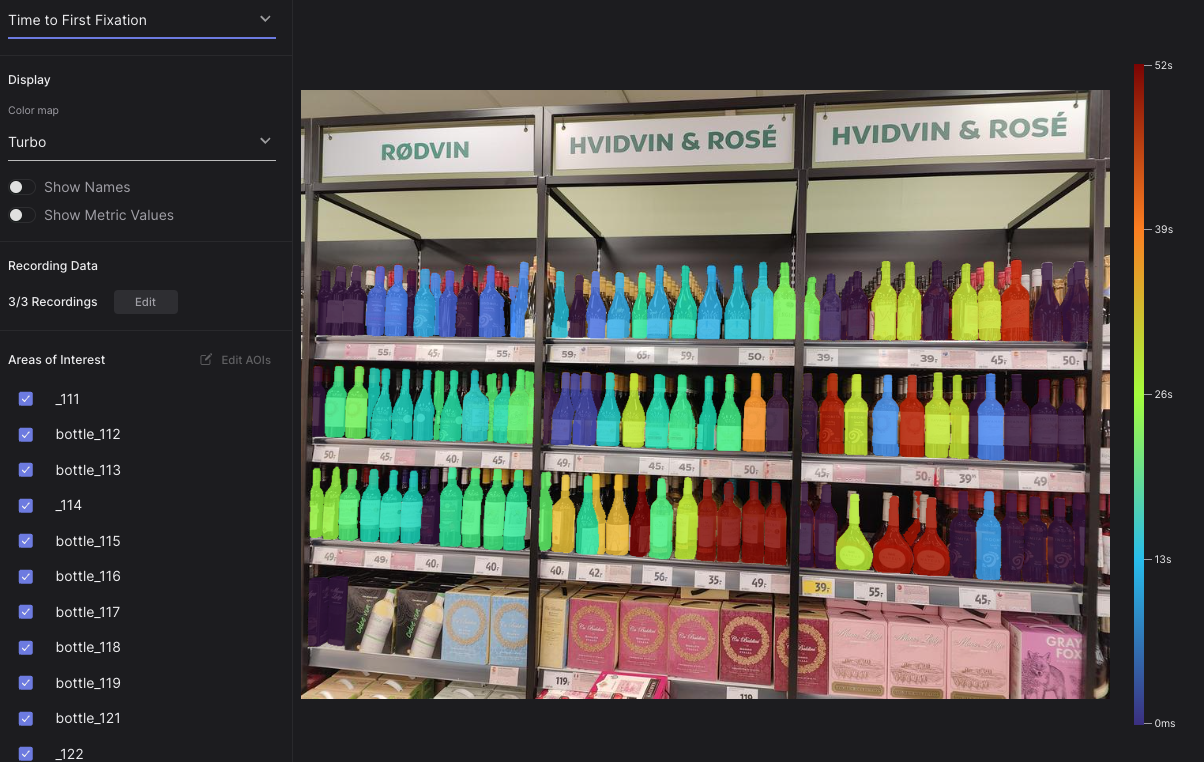
Automate AOI Masking in Pupil Cloud
Extend the capabilities of Pupil Cloud's AOI tool by automatically segmenting and drawing masks using natural language.