Real-Time Eyelid Dynamics with PERCLOS and Neon
TIP
From subtle blinks to sustained closure, the story of alertness is written on your eyelids. Now you can read it in real time.
Tracking of Eye Openness for Real-World Demands
Tracking fluctuations in alertness, drowsiness, and fatigue is a key objective across disciplines—from cognitive neuroscience and human factors to applied domains such as transportation safety and adaptive user interfaces. One of the most widely used metrics in this space is PERCLOS (Percentage of Eye Closure), defined as the proportion of time the eye is at least 80% closed, which serves as a reliable indicator of vigilance and fatigue levels.
In this tutorial, we introduce a real-time tool for computing and visualizing PERCLOS using live data streamed from our latest eye tracker, Neon. Whether you're building fatigue detection systems, running experiments on sustained attention, or exploring eyelid dynamics in naturalistic settings, this guide provides a practical starting point for integrating real-time eyelid aperture and PERCLOS into your research workflows.
From Raw Signal to Actionable Metric: PERCLOS With Neon
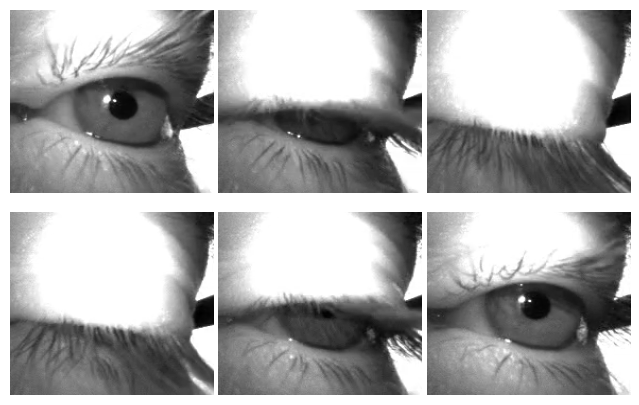
Neon provides Eye Openness as one of its native data streams, offering a continuous measure of eyelid aperture in millimetres by capturing the maximum arc length between the upper and lower eyelids. With recent updates to the Neon Companion App and Real-Time API, these signals are now accessible in real time, opening the door to the live computation of cognitive and physiological state indicators.
We therefore created this script to demonstrate how to compute PERCLOS in real time. It displays rolling plots of percent eye closure and PERCLOS alongside a live eye camera feed to support intuitive monitoring and interpretation.
How to Try It Yourself
Access this script here, connect your Companion Device and your computer to the same network, and then run the following command in your terminal:
uv run -s calculate_perclos_real_time.pypython3 calculate_perclos_real_time.pyINFO
The rolling window size determines the duration (in seconds) over which the PERCLOS value is continuously updated. For example, a 10-second window means that at every moment, the tool computes how much of the past 10 seconds the eye has been ≥80% closed. We chose 10 seconds as the default to balance sensitivity and stability, but this value can be adjusted based on your specific research goals or responsiveness needs. A shorter window makes the system more reactive to recent changes, while a longer one smooths out rapid fluctuations.
Live Output and Saved Results
Running this tool will open a real-time visualization displaying the percent eye closure per frame and the rolling PERCLOS calculation, based on user-defined time windows. These values are also printed live in your console for immediate feedback.
Additionally, all data is automatically saved to a CSV file (perclos_data_{date}.csv) once you close the tool. The file contains three columns: timestamp, percent_closed, and perclos.
Feel free to adapt and integrate the PERCLOS calculation into your own real-time application.
TIP
Need help integrating PERCLOS or other eyelid-related metrics into your analysis pipeline? We’re here to help! Feel free to reach out to us via email at info@pupil-labs.com, our Discord server, or visit our Support Page for formal support options.
Detect Eye Blinks With Neon
Apply Pupil Labs blink detection algorithm to Neon recordings programmatically, offline or in real-time using Pupil Labs real-time Python API.
Build an AI Vision Assistant
Experiment with assistive scene understanding applications using GPT-4V (an extension of GPT4 that can interpret images) and Pupil Labs eye tracking.
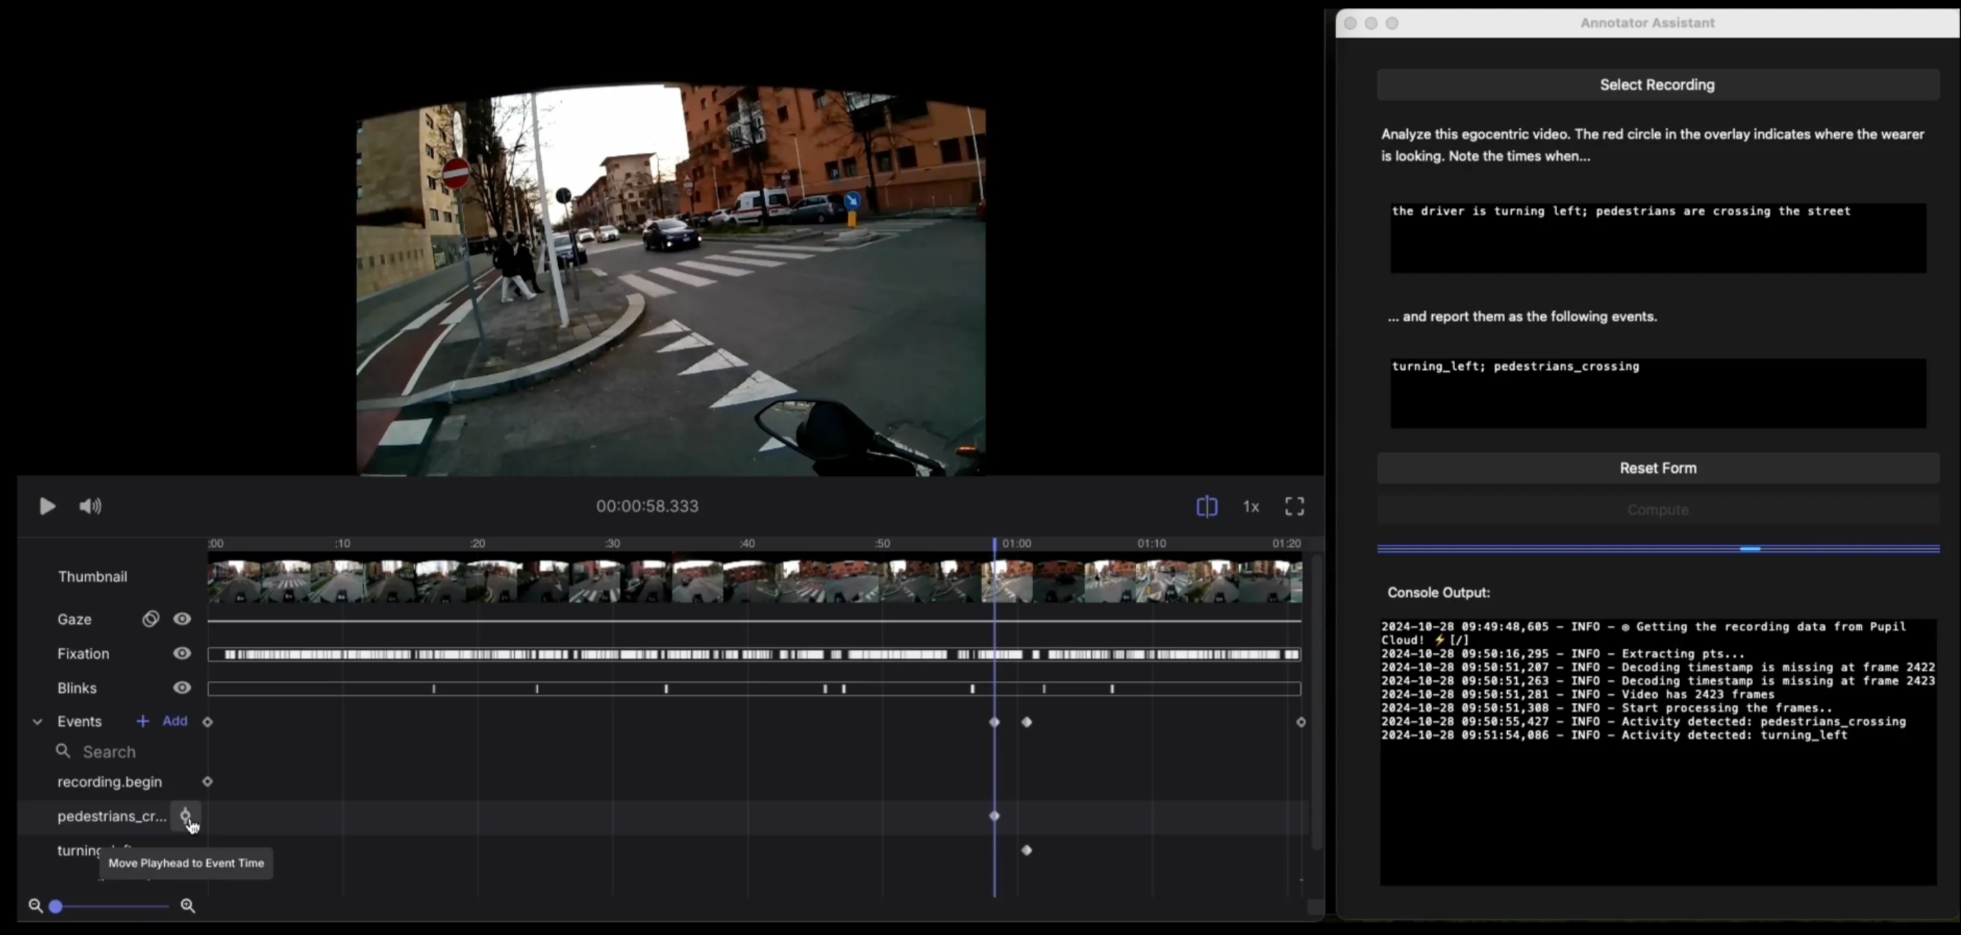
Automate Event Annotations With Pupil Cloud and GPT
Automatically annotate important activities and events in your Pupil Cloud recordings with GPT-4o.