AOI Heatmap
Upon creating areas of interest (AOIs) for your enrichment, you can visualize the AOI-related metrics in the AOI Heatmap view. The AOI Heatmap provides a spatial representation of various fixation metrics aggregated across AOIs, allowing you to quickly identify patterns and areas of high engagement within your reference image or surface.
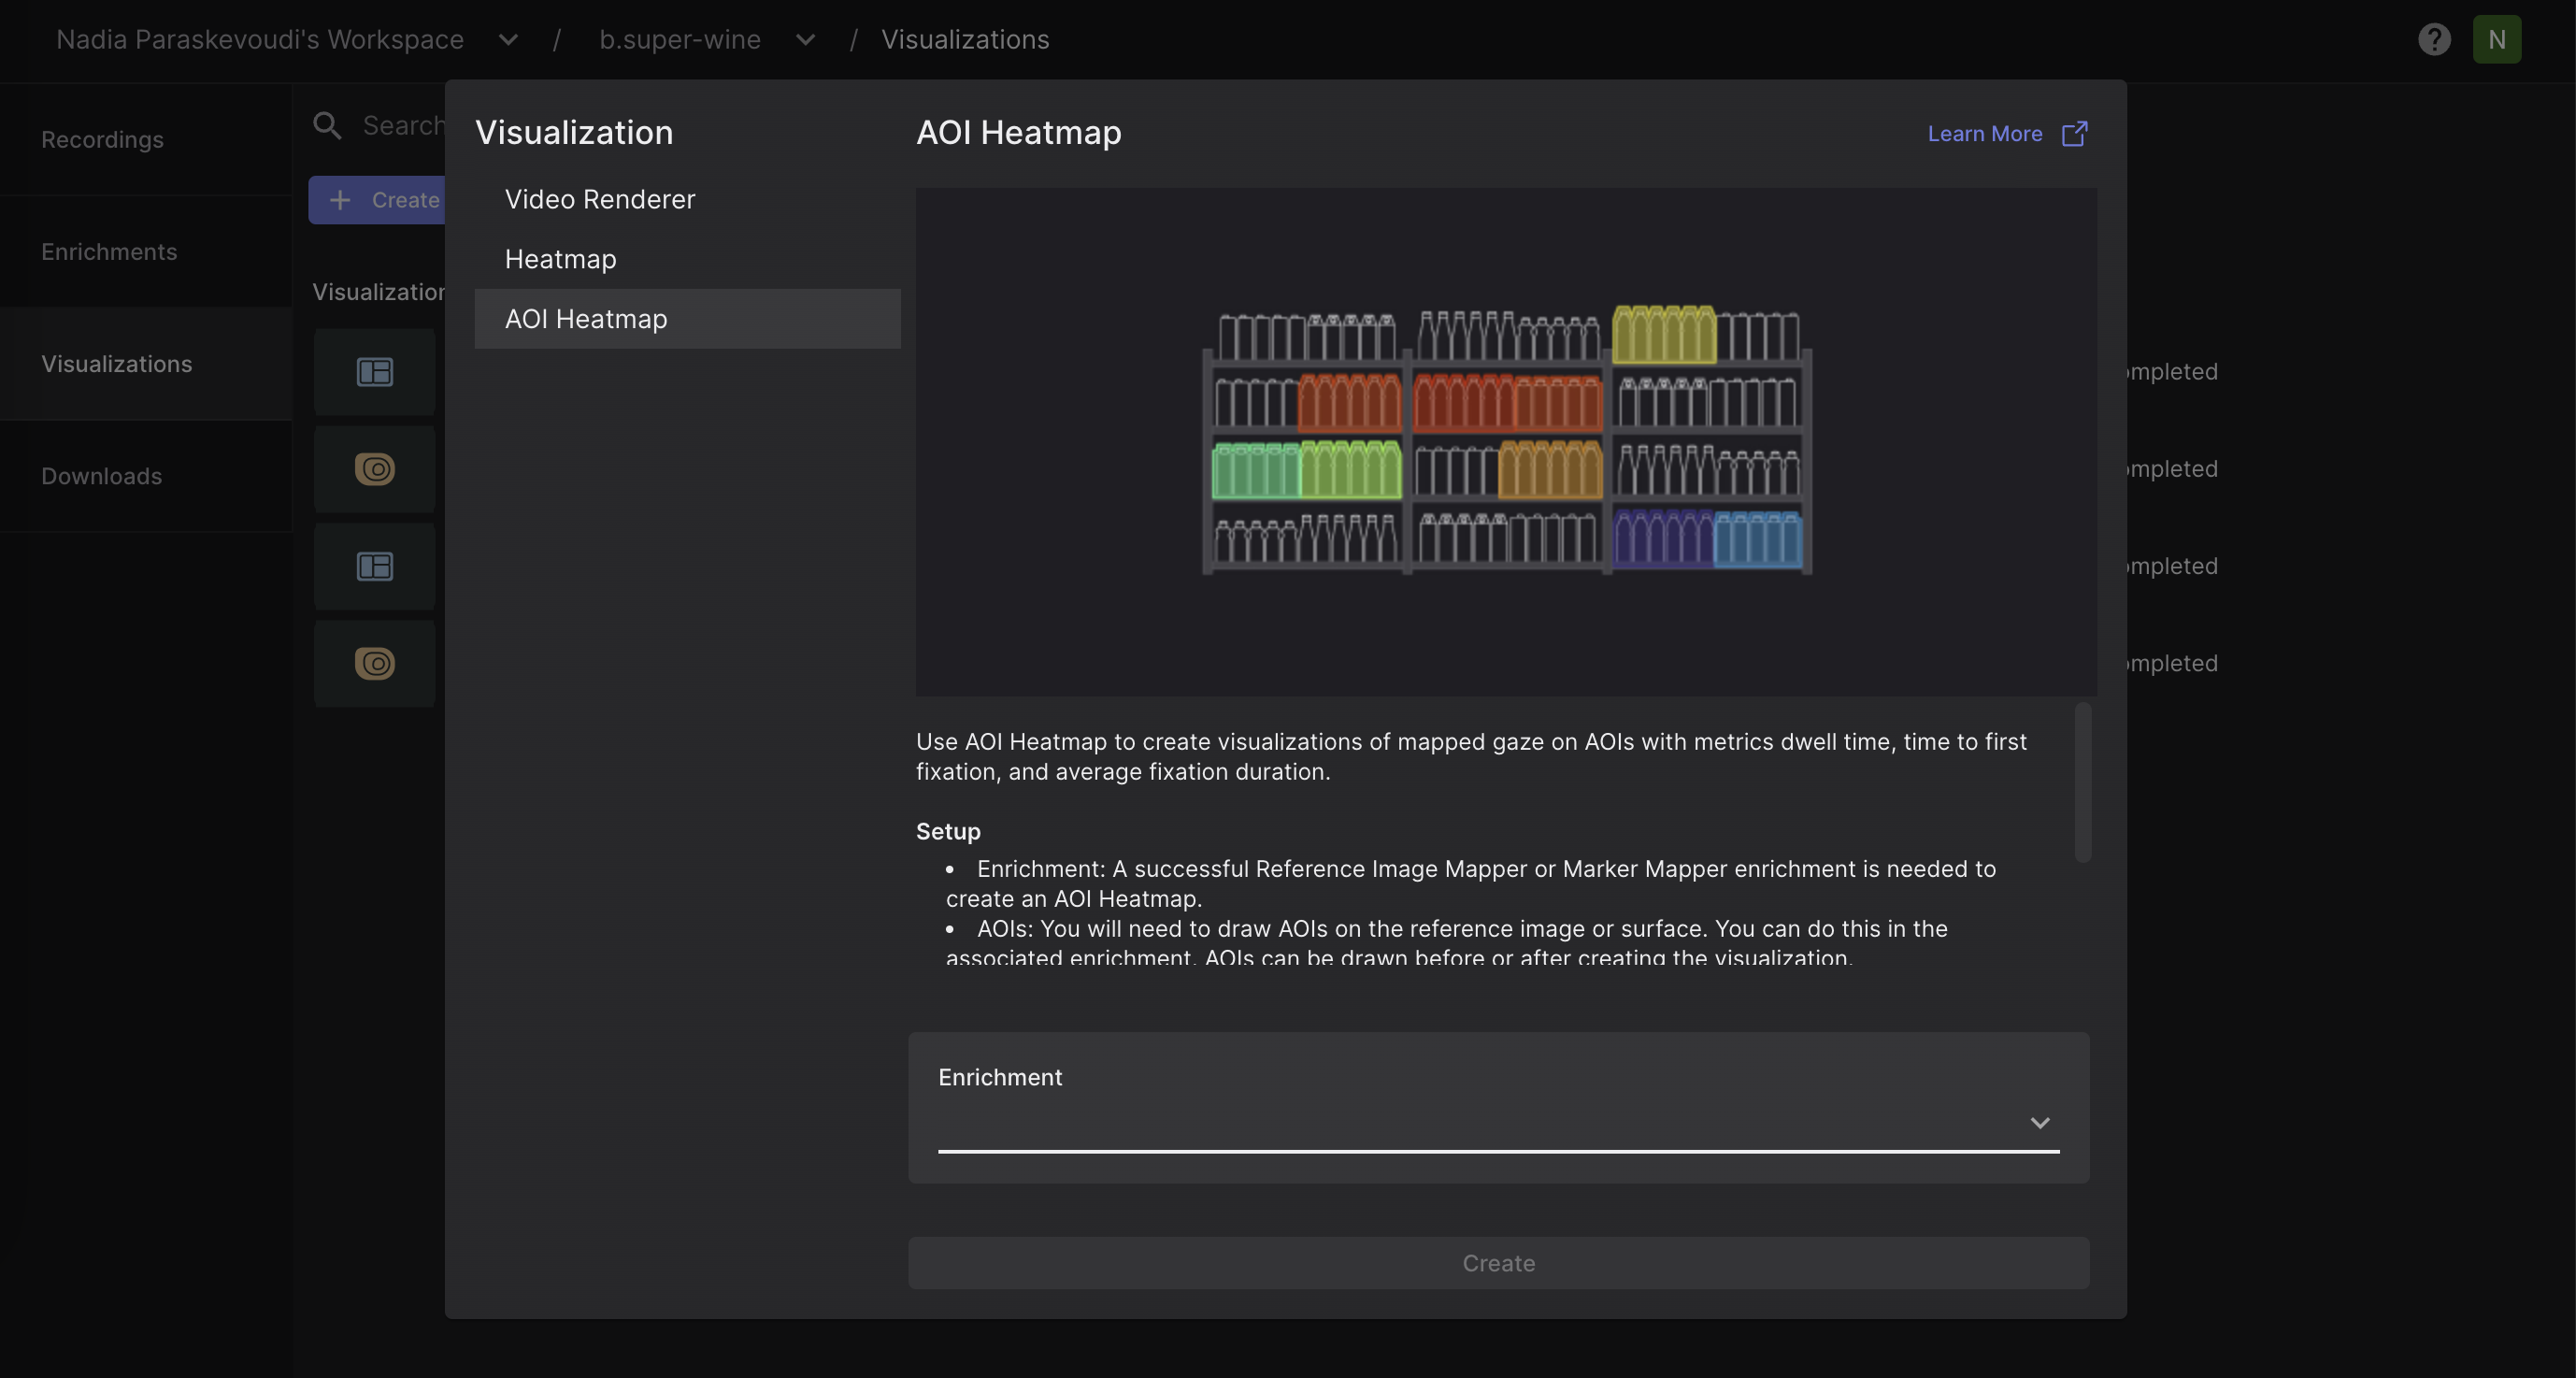
To visualize your AOI heatmap:
- Navigate to the
Visualizationstab. - Click on
Create Visualization. - Select
AOI heatmapand the enrichment to which it should be applied.
Within the AOI Heatmap view, users can specify the recordings to be included, the metric to be displayed, and which AOIs should be incorporated into the visualization. In the recording drop-down selector, you can view the fixation count for each recording. This provides a clearer understanding of exactly what data is contributing to the visualization.
Export Format
In the AOI Heatmap view and the Downloads view, you can download:
- The final visualization displaying the metric of your interest in
.pngformat.
The download would also contain the AOI metrics in .csv format, as reported in the AOI Metrics CSV.