Surface Tracker
You can use this plugin to detect markers in the recording, define surfaces, edit surfaces, and create and export visualizations of gaze data within the defined surfaces.
Setup
Ensure that your recording contains AprilTag Markers, like the ones you would use with the Marker Mapper.
Workflow
Here is an example workflow for using the Surface Tracking plugin to generate heatmap visualizations and export surface-mapped data:
Load the Surface Tracking Plugin: Open your recording in Neon Player and navigate to the Plugins section in the right-hand panel. Click
Add/Removeand enableSurface Tracking.Add a Surface: If no surfaces exist yet, you can create one, by clicking on the
+ Add surfacebutton when the markers you want to use are visible.Define Surface Properties: Once the surface is created, configure it in the
Surface Trackingpanel:Name: Assign a meaningful name (e.g. screen, worksheet, poster). This name will be used in visualizations and exports.
Verify Surface Detection: To visually confirm that the surface is being tracked correctly, you can enable
Draw marker IDsand/orDraw namesto overlay marker information on the scene video.The detected surface outline should remain stable even when the participant or camera moves. Scrub through the timeline to ensure the surface is detected consistently throughout the recording.
- Visualize Gaze on the Surface: With a surface selected, you can click
Editto drag the corners and adjust the surface as needed. Additionally, you can enableShow heatmapto overlay a gaze heatmap on the surface. From there, you can adjust:- the
Heatmap smoothnessto control spatial smoothing, - the
Heatmap alphato change transparency, - the
Heatmap colorto choose a color map that best fits your visualization needs.
- the
These settings only affect visualization and do not alter the underlying data. You can also click View Surface to switch from the scene view to a direct, front-facing view of the surface.
Timeline View
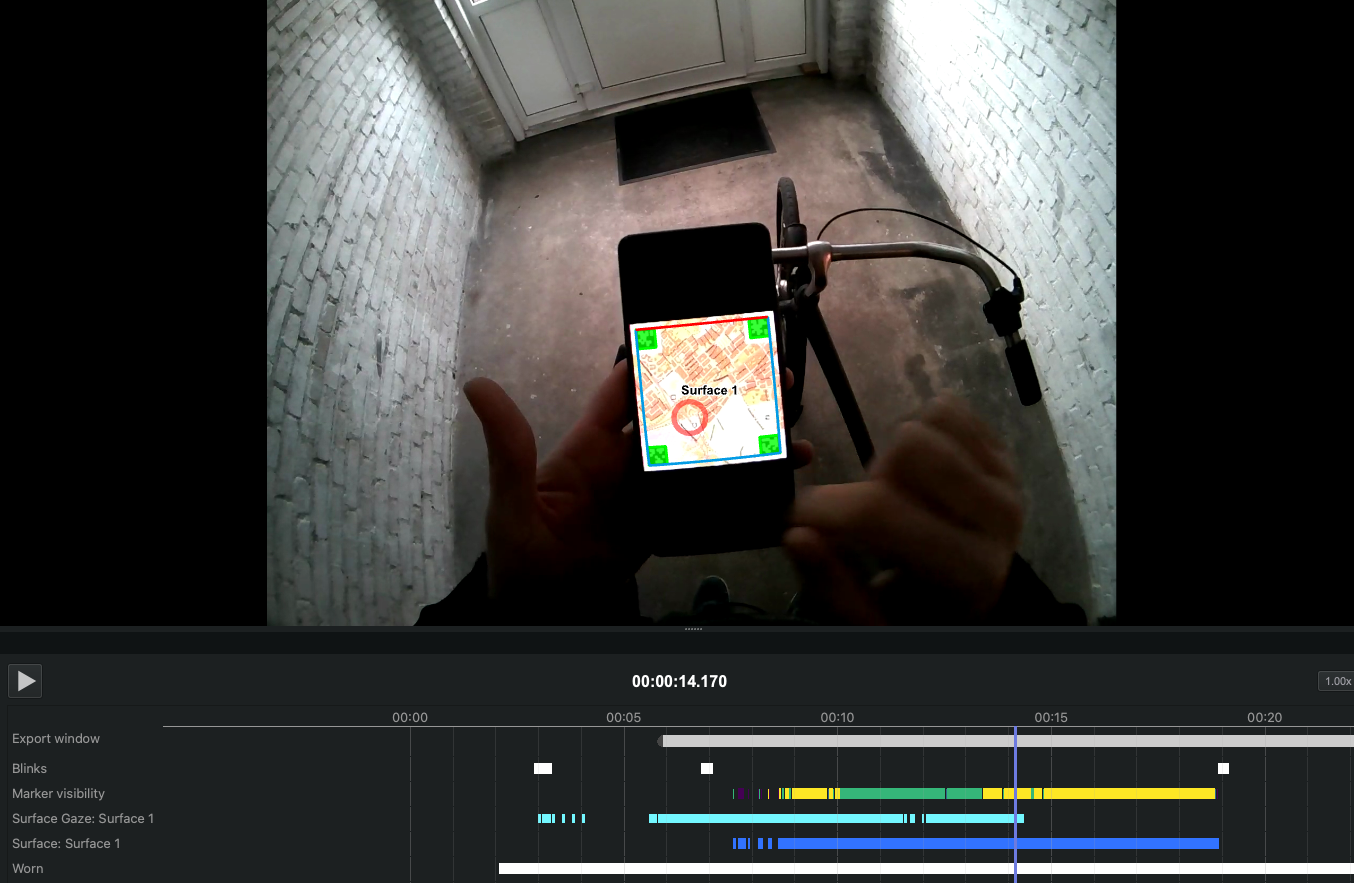
In the timeline view:
Marker visibilityprovides a quick visual indication of how many markers are detected in each video frame. The track is color-coded using the Viridis colormap, where darker colors indicate fewer detected markers and brighter colors indicate more detected markers. This helps identify time segments where surfaces are well supported by visible markers versus segments where detection may be unreliable.Surface Gaze: <surface name>highlights, in blue, the segments of the recording where gaze is mapped onto the detected surface.Surface: <surface name>indicates the portions of the recording in which the surface is successfully detected.
Export Format
Once you're satisfied with the surface tracking and visualization, you can click on Export within the surface panel to generate surface-based gaze and fixation data. The following files will be exported.
gazepositions_on_surface<_surface_name>.csv
This file contains all the mapped gaze data from all sections.
| Field | Description |
|---|---|
| timestamp [ns] | UTC timestamp in nanoseconds of the sample. Equal to the timestamp of the original gaze sample before mapping. |
| gaze detected on surface | Boolean indicating whether the gaze point was inside or outside of the surface. |
| gaze position on surface x [normalized] | Float value representing the x-coordinate of the mapped gaze point in surface coordinates. If the surface was not localized this value is empty. |
| gaze position on surface y [normalized] | Same as gaze position on surface x [normalized] but for y-coordinate. |
fixationson_surface<_surface_name>.csv
This file contains fixation events detected in the gaze data stream and mapped to the surface.
| Field | Description |
|---|---|
| fixation id | Identifier of fixation within the section. The id corresponds to the fixation id of the raw unmapped data. |
| start timestamp [ns] | UTC timestamp in nanoseconds of the start of the fixation. |
| end timestamp [ns] | UTC timestamp in nanoseconds of the end of the fixation. |
| duration [ms] | Duration of the fixation in milliseconds. |
| fixation detected on surface | Boolean indicating whether the fixation was inside or outside of the surface. |
| fixation x [normalized] | Float value representing the x-coordinate of the fixation in surface coordinates. This position is the average of all mapped gaze samples within the fixation. |
| fixation y [normalized] | Same as "fixation x [normalized]" but for the y-coordinate. |
If Show heatmap is selected, a heatmap in .png file will be also exported.